
After months of anticipation and testing, Google has just announced the release of Custom Annotations within the Search Console Performance Reports. SEO professionals and webmasters alike are heralding this feature as a major enhancement in the right direction, enabling users to add contextual notes directly onto their traffic charts with much-needed clarity for performance analysis.
The feature has been in testing since May of 2025, intended to solve a perennial problem, knowing exactly when an important change to a website or an external event that could have affected search traffic occurred.
Bridging the Data Gap
Google defines custom annotations as "Notes you create yourself to mark important events specific to your property," effectively making the Search Console chart a collaborative change log.
Previously, website managers typically had to refer to an external spreadsheet or some other project management tool to correlate performance dips or spikes with the actions taken on the site. Now, that historical context is baked right into the data visualization.
Key Use Cases of the New Feature
Being able to annotate a given date directly in the performance graph provides a very clear mechanism for tracking cause and effect. Google highlights several key scenarios where custom annotations will be invaluable:
- Changes to Infrastructure: Major technical updates, for instance, site migration, template overhaul, or server maintenance, are documented.
- SEO Campaigns: Setting the start or end date of a significant SEO campaign, like implementing a new schema markup, fixing an issue with Core Web Vitals, or hiring an external agency.
- Content Strategy Shifts: Noting when a major batch of content was updated or optimized to target new user intent keywords.
- Events Outside of Website: Logging off-website factors contributing to traffic fluctuations, which can include major public holidays, product releases, or even a confirmed Google algorithm update.
How to Use Custom Annotations
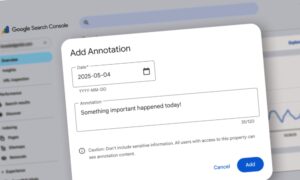
Adding an annotation involves only a few clicks in the Search Console interface:
- Open the desired performance report: Search Results, Discover, or News.
- Right click on the chart over the specific date you want to annotate.
- Select "Add annotation," then select the date.
- In the text field, type a note. (maximum of 120 characters)
- Click Add to save the note.
Thereafter, the annotation will be a visual marker on the chart and an immediate visual reference for all users of the property. Users can have up to 200 annotations per property.
This will, in turn, enable SEO professionals and digital marketing teams worldwide to report more efficiently and make smarter, faster decisions, having been able to correlate performance data with specific site changes quickly.
This has been a long-requested feature by the SEO community, and its release cements Search Console's position as the hub of website health and search performance monitoring.
To get the latest updates, visit KnowledgeNile
Also Read:
What Is Google Speed Update and How Does It Work?
What is Google Rank Transition & What does it signify in SEO?
")

