Businesses nowadays have gone beyond data and trends, integrating sophisticated strategies and actionable insights for decision-making. In this regard, BI or business intelligence offers a holistic approach to organizations to mitigate risks and attain business efficiency.
Pentaho, Power BI, and Tableau are among the top BI tools that not only collect and analyze data but also visualize data to retrieve actionable insights for informed decision-making. In 2025, the global BI industry stands at a valuation worth $33 billion, which is soon to reach $54 billion by 2030.
Organizations around the globe are increasingly adopting BI strategies. However, companies often face challenges when choosing the appropriate BI tool. Here is a thorough comparison between the top BI software- Pentaho vs. Power BI vs. Tableau to help you understand which tool to opt for. Let us first assess business intelligence and its advantages...
Understanding Business Intelligence:
Business intelligence can be defined as a strategic process to gather and analyze data, alongside extracting valuable insights from datasets. These insights ultimately help organizations to develop informed business strategies and advance operations with high efficiency.
BI tools and strategies help organizations not only manage their customers effectively but also empower them to manage their workforces in a better way. For this purpose, BI software assesses both historical and real-time data.
Business intelligence is beneficial for both small and large firms, where data analysts, business leaders, and executives can utilize it. Data source, data warehouse or mart, data mining, data collection, analysis, optimization, visualization, etc., are the core elements and stages of BI. AI-enabled BI is one of the prevalent trends that has influenced different businesses lately.
Advantages of Business Intelligence:
Business intelligence tools like Pentaho vs. Power BI vs. Tableau can be increasingly beneficial for organizations if implemented effectively. Here are the key advantages-
Data-driven Decision-Making:
We all know how data-driven insights help in business advancement. It assists in developing effective and flawless strategies that can drive beneficial results. Since BI involves data assessment and implementation, it enables organizations to make data-driven decisions.
Better Ways to Utilize Data:
Although data is a crucial element for businesses, many organizations struggle to integrate data effectively due to several reasons. In this regard, BI not only collects data but also helps extract valuable insights for organizational growth.
Increased Customer and Employee Satisfaction:
In-depth data, provided by BI, highlights the specific needs of customers. While meeting those needs, companies can boost both customer satisfaction and employee productivity.
Overview of Pentaho:
Pentaho is a leading business intelligence platform that offers scalable data integration. Established in 2004 by Pentaho Corporation, the platform was acquired by Hitachi Data Systems in 2015. Currently, it excels in data integration, online analytical processing, data mining, ETL, reporting, and business intelligence services.
The key products include Pentaho Data Optimizer (PDO), Pentaho Data Catalog (PDC), PDI & PBA. The platform is ideal for both enterprises and startups across various industries, including retail, finance, healthcare, and e-commerce.
Benefits of Using Pentaho:
-
- Convenient Usage: Pentaho is a user-friendly platform that has drag-and-drop functionality. Whether you have a technical or non-technical background, you can use this BI tool conveniently with easy navigation.
- Easy Data Management: The platform follows an end-to-end data management process. It enables users to manage their data within one platform throughout the data journey.
- Cost efficiency: The BI tool offers a flexible pricing structure that allows users to tailor it according to their specific needs and goals. So, it also lets organizations save costs.
- Higher efficiency and scalability: Pentaho has a scalable architecture with advanced capabilities for both enterprises and small firms. Furthermore, it incorporates automation that can save time and boost efficiency.
Pricing: Pentaho’s pricing is not publicly available. However, the platform has a flexible pricing model and subscription-based licensing. Additionally, it has an open-source structure.
Overview of Power BI:
Microsoft Power BI is a cloud-based business intelligence tool that is a segment of the Microsoft Power Platform. Power BI offers a toolkit of advanced software that outperforms data visualization, data warehouse, data preparation, mining, and other BI facilities.
Though the early stones of this platform were laid in 2010 by Ron George and were known as Project Crescent, it was later renamed by Microsoft in 2013. The public launch took place in 2015 in mobile application, web, and desktop versions. Power BI Desktop, Power BI Service, Power Query, Power Pivot, DAX, Power BI Report Server, etc., are core components of this BI platform.
Benefits of Using Power BI:
-
- Data security on priority: Microsoft Power BI puts data security at the top while providing BI and visualization services. Robust permission settings, sensitivity labels, built-in compliance measures, alongside row-level and object-level security features, are strengthening the security framework of this platform.
- Sophisticated data visualization: While offering data visualization facilities, Power BI enables in-depth reports and personalized dashboards that can meet the unique needs of diverse users. It can turn complex data into easy-to-understand and compelling visuals, which helps in convenient data integration.
- Flexibility and Easy customization: It is a flexible BI platform with an interactive dashboard that can be easily tailored to business requirements. Since it is cloud-based, data management and storage concerns can also be handled flexibly.
- Advanced Collaboration: Power BI integrates with other Microsoft tools and platforms, including Excel, Teams, SharePoint, Power Apps, and others. Such an approach enhances collaboration across platforms for users.
Pricing: Power BI has a need-specific pricing plan, where the Pro version starts from $14/ month per user. It also has a free version with limited facilities.
Overview of Tableau:
Established in 2003, Tableau is one of the most preferred BI and data visualization platforms. It was founded by Tableau Software, LLC and later acquired by Salesforce in 2019. The platform is redefining how companies use data to solve their problems with assistance in seeing, understanding, and acting on data. Tableau can help businesses in not only effective decision-making but also in boosting productivity by unlocking advanced visual analytics. It can easily process larger raw datasets and transform them into visualizations.
Tableau Desktop, Server, Prep Builder, Vizable, Public, Reader, Prep, etc. are the key products in Tableau toolkit.
Advantages of Using Tableau:
-
- Easy-to-use: Tableau has a user-friendly interface with drag-and-drop functionality. Its ‘Show Me’ tab helps technical and non-technical users to operate the platform and create interactive visualizations.
- Advanced data analysis and visualization: Tableau includes cutting-edge data analysis and visualization features, such as Data Guide, Tableau Pulse, and others. The visualization within this platform offers a wide range of charts, graphs, and maps, through which users can create compelling designs.
- Strong customer support: This BI platform is known for its extensive community and easily available customer support system. Users can conveniently access online resources, forums, guides, and training on how to use and excel in Tableau.
- Data source compatibility: Tableau seamlessly integrates with multiple data sources during BI process execution. It utilizes historical and real-time data from various sources, enabling businesses to extract valuable insights.
Pricing: Tableau has both free and paid versions. Businesses can unlock facilities as per their needs and budget. The paid plan starts from $15/person per month.
Pentaho vs. Power BI vs. Tableau: Identifying the Key Differences:
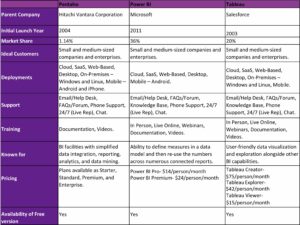
The business intelligence tools industry is highly competitive with advanced services and facilities. Here, Microsoft Power BI holds 36% of the market share, whereas Tableau has a 20% share. On the contrary, Pentaho has only a 1.14% share. Nevertheless, all three platforms are equally effective and can advance your decision-making process alongside your business.
Let us get a clearer picture of the major distinctions between Pentaho vs. Power BI vs. Tableau:
The Future of Business Intelligence!
Since BI offers valuable insights into a business, its target audience, and market, it can be integrated for diverse purposes, from building business models to governance strategies, marketing initiatives to customer retention methods. Comparing Pentaho vs. Power BI vs. Tableau is tough since all the tools facilitate top-notch BI services.
However, while opting for the appropriate platform for your business, considering the usability and accessibility of the platform, its cost, security, and compliance parameters are crucial. Additionally, it is important to assess whether the service provider’s goals align with your business objectives or not.
Follow our blog updates to learn about the latest trends and impactful tools transforming the business sector!
FAQs:
1. Which is more better, Power BI or Tableau?
Answer: Both Power BI and Tableau offer advanced business intelligence and data visualization services. While Tableau is known for its interactive visualizations and customization, Power BI boasts strong interactivity but with comparatively fewer opportunities for customization.
2. Is Pentaho a BI tool?
Answer: Pentaho is a popular BI tool that has both open-source and paid versions.
3. Which tool is better than Power BI?
Answer: Many consider Salesforce’s acquisition of Tableau to be a better option than Power BI.
4. Does Tableau require coding?
Answer: No, Tableau does not require coding. Users can use this BI platform without having coding knowledge.
Recommended For You:
Business Intelligence Tech Trends and Real-World Applications


