A shipment may be on schedule today, but congestion at its destination could delay its arrival next week. If a manufacturer discovers the problem too late, production may suffer.
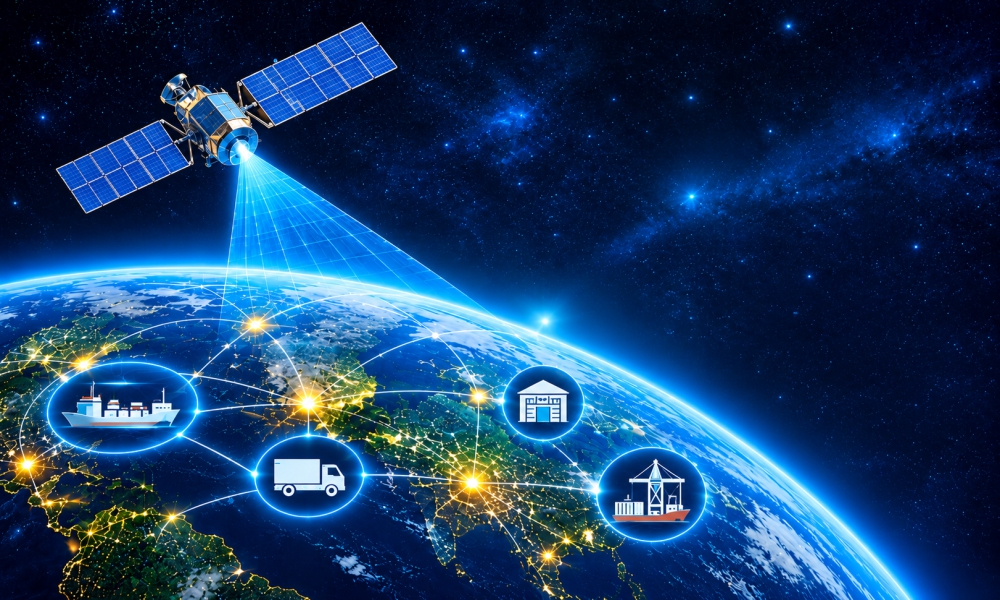
Traditional supply chain forecasts use shipping records, supplier updates, historical demand, and inventory data. Commercial satellite data adds observations from ports, agricultural regions, and selected industrial locations. Combined with other information, these observations can help businesses assess potential disruptions earlier.
Businesses exploring satellite data supply chain forecasting can use these additional observations to investigate risks before they affect operations.
How Does Satellite Data Turn Observations Into Forecasts?
Satellite data provides observations, not guaranteed predictions. Businesses must convert those observations into measurable indicators and analyze them alongside relevant information.
Satellite imagery can reveal changes in port activity or vegetation. Satellite-based vessel tracking provides information about maritime movements. These are different data sources, but both can contribute to supply chain analysis.
Forecasting models use relevant indicators, historical records, and other data to estimate possible outcomes. Their reliability depends on data quality, model performance, and whether past patterns still apply.
Effective satellite data supply chain forecasting connects these observations to specific business questions, such as whether a shipment might be delayed or whether raw material availability could change.
Can Satellite Data Help Predict Shipping Delays?
Port congestion can delay shipments and cause shortages of essential components. Spotting these issues early can help businesses investigate possible delays.
A study published in the Journal of the Royal Statistical Society: Series A used Sentinel-2 satellite images and deep learning to develop a Port Saturation Index for 16 major European ports between 2017 and 2023.
Similarly, a 2026 study in Remote Sensing explored how satellite imagery, vessel-tracking data, and news reports can help assess port disruptions.
These studies show how different data sources can help businesses monitor port conditions and investigate potential delays.
For example, consider a manufacturer importing electronic components. If congestion increases at a port used by its suppliers, the manufacturer can review affected shipments and check whether its inventory will cover possible delays.
However, higher port congestion does not prove that a particular shipment will arrive late. Businesses should assess these indicators alongside other relevant information.
How Can Satellite Data Improve Global Trade Forecasts?
Shipment delays and changes in global trade are related, but they require different analyses.
The first concerns individual deliveries. The second examines broader changes in maritime activity that could affect sourcing decisions and international supply chains.
In its 2025 working paper, Nowcasting Global Trade from Space, the International Monetary Fund examined how vessel-movement data can support timely estimates of global maritime trade.
The research uses port-level information from IMF PortWatch to help estimate trade activity. Such estimates can provide additional context when businesses review international sourcing risks.
For example, a sustained change in maritime activity along an important route could prompt analysts to investigate the cause and review their sourcing assumptions.
These estimates do not directly forecast a company's material requirements or replace official trade statistics. Supplier records, purchasing data, and market information are still needed to assess the operational impact.
Can Satellite Imagery Help Forecast Raw Material Shortages?
Agricultural supply chains face a different challenge. Raw material availability can change before harvesting begins.
Satellite imagery can help monitor vegetation conditions and crop development across large areas. When combined with weather information, historical yields, and agricultural models, these observations can support crop-yield forecasts.
A 2026 review published in Agriculture examined how satellite remote sensing is used to predict crop yields. It discusses different approaches that use satellite imagery and machine learning to estimate agricultural production.
For example, a food manufacturer that depends on wheat could use crop forecasts to assess supply risks in important growing regions. If production is expected to fall, its purchasing team could review orders, contact suppliers, or investigate alternative sources.
Forecasts remain uncertain because weather, disease, and local growing conditions can affect crop development. Their value lies in helping businesses assess possible supply changes before final harvest figures become available.
Can Commercial Satellite Data Help Identify Supplier Disruptions?
Changes around a supplier's facility may indicate whether its operations have changed.
Depending on image resolution and observation frequency, commercial satellite imagery may reveal changes in construction, land use, storage areas, or visible site activity.
For example, if a supplier's facility shows unexpected changes, the procurement team can contact the supplier to check whether production has been affected and plan accordingly.
However, visible changes do not confirm actual production levels or prove that a supplier is experiencing difficulties. Businesses need to verify these observations against supplier communications, operational records, and other relevant evidence.
Satellite imagery is therefore best used to identify locations that may require further investigation, rather than as a standalone predictor of supplier failure.
How Should Businesses Measure the Value of Satellite-Based Forecasting?
Businesses need to establish whether satellite-derived information improves their forecasts enough to justify its cost.
Start with one recurring problem, such as port-related delivery delays. Record the current forecasting method's performance, then compare it with a method that includes satellite-derived indicators.
This evaluation matters for satellite data supply chain forecasting because more information does not automatically produce better predictions.
Three measures can help assess the difference:
Forecast accuracy: Are predicted delays or supply changes closer to actual outcomes?
Warning time: Does the business identify potential problems earlier?
Business impact: Does better information reduce stockouts, emergency shipping costs, or avoidable production interruptions?
Also consider subscription costs, data integration, analytical resources, and false alarms. If the added information does not improve decisions, adopting the technology may not be worthwhile.
Conclusion
Satellite data can help businesses spot supply chain issues before they become major problems. From port congestion to crop conditions and supplier activity, it provides useful information for better planning. Businesses using satellite data for supply chain forecasting can start with one area, such as tracking shipping delays or monitoring raw material supplies. If the data helps them make better decisions and avoid disruptions, they can consider using it in other parts of their supply chain.
Visit our website to learn more.
FAQs
1. Can satellite data be integrated with existing supply chain software?
Answer: Yes, satellite data can be connected directly into existing supply chain systems through APIs or data platforms.
2. What is the difference between satellite imagery and satellite tracking data?
Answer: Satellite imagery is a photo; satellite tracking data is a location ping.
Here is the simple breakdown:
Satellite Imagery (The Photo): Satellites imagery provides pictures of the earth's surface from space. Businesses use these photos to look at traffic jams at ports or check if farm crops look healthy.
Satellite Tracking Data (The Ping): Satellites can receive electronic signals transmitted by ships (called AIS signals). This gives you the exact GPS location, speed, and path of a specific ship on a map.
Also Read:
How Satellite Imagery Can Uncover Hidden Stories About Abandoned Places